Let’s look at WILDFIRES in the US and Oregon
Where do most US wildfires happen?
Do weather factors contribute to the probability of fires?
Wildfires, a phenomenon where an uncontrolled fire that burns in the wildland vegetation, has been a growing concern in the US in recent years. For our final project, we will be using machine learning techniques to explore instances of wildfires across Oregon, in the United States. As wildfires become increasingly common, it is crucial to equip policy-makers and first responders with tools to help better predict areas that are most likely to set ablaze across the State.The data was taken from Kaggle. This project is inspired by Ali Ahmadalipour’s work.
US Wide Wildfires
Causes
We observe trends in common causes of wildfires by year. To interact with the visualization, select a year from the center of the wheel. The information becomes increasingly detailed as the wheel is explored outwards.
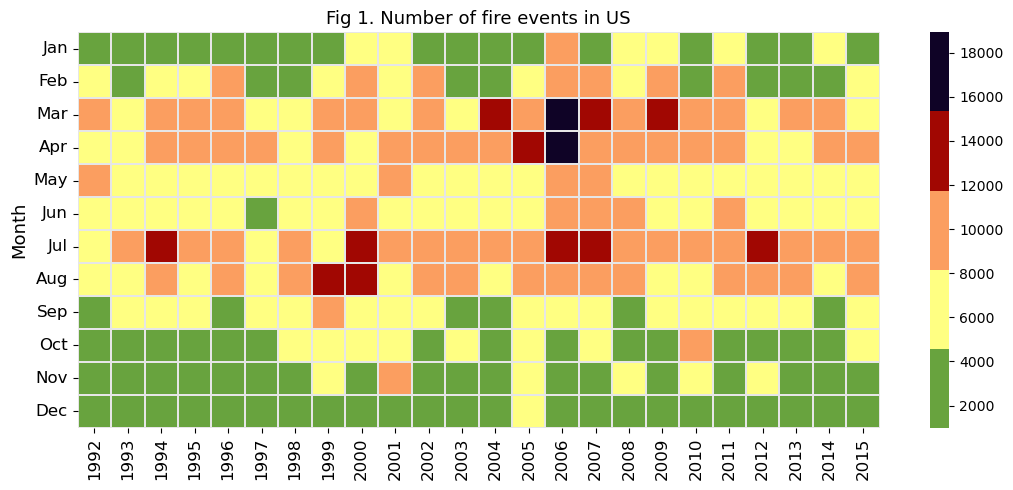
The visualization below shows spread of recorded wildfires across the year, with the darker colors indicating more instances of wildfire. Across the last 24 years, late spring and late summer saw the most burning, with a period of increased fires during the spring of 2006. On average, less than 8,000 fires burn per month across the US - however, certain months tend to tell another story, where more than 16,000 burned in the same time period. There appears to be a slight dip in fires during the early summer months of May and June.
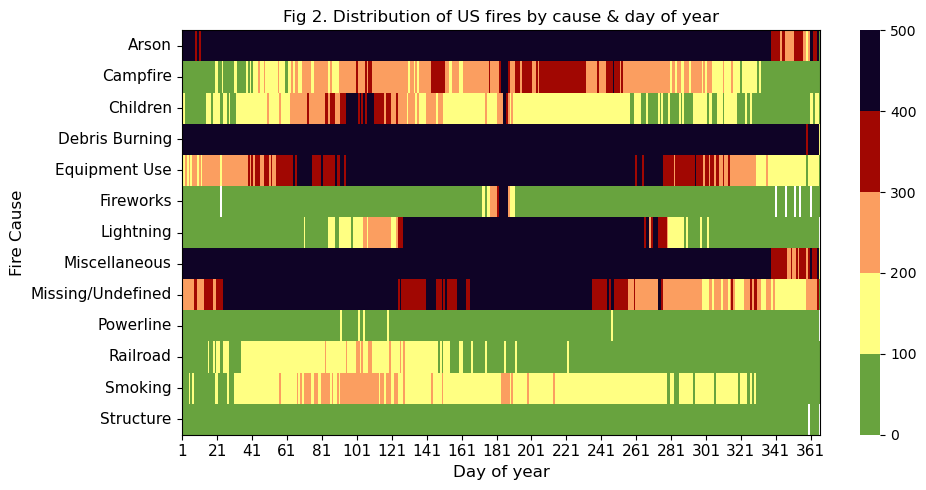
Next, we observe which activities are the most likely causes of wildfires across the country depending on the time of year. According to the visualization above, arson, debris burning, and other mixed causes are commonplace throughout the year, while other common reasons tend to spike in specific seasons. For example, lightning strikes and equipment use are common causes during the summertime, when summer storms bring seasonal spikes in thundering clouds, and when people are more likely to get outside and run types of equipment that have the ability to catch ablaze. An interesting observation lies in the missing and undefined category, which is most likely to be recorded in the first half of the year.
Dashboard (Acres burnt by State)
The below interactive dashboard shows total acres burnt between 1992-2015 in each US state. See below for an interactive Dashboard ↓
Oregon’s Wildfires
When discussing wildfires in the US, California is usually front and center of the narrative. However, many other states that experience similar rates of burning, yet are often left off the table. We’d like to change that narrative, focusing on Oregon’s recent wildfire trends. To complete this study, we have chosen to dig into observations taken between 2014-15.
The map above highlights point data for observed wildfires across this span of time. To explore the data, use the toggle on the top to select a year. It is observed that, while wildfires occur in nearly every area of the state, they tend to be concentrated to the west, where a majority of the forests and heavily-forested areas are. However, in order to get better at preventing wildfires, it’s important to understand what factors may most contribute to their ignition. The following exploratory analyses use data that may contribute to predicting fires.
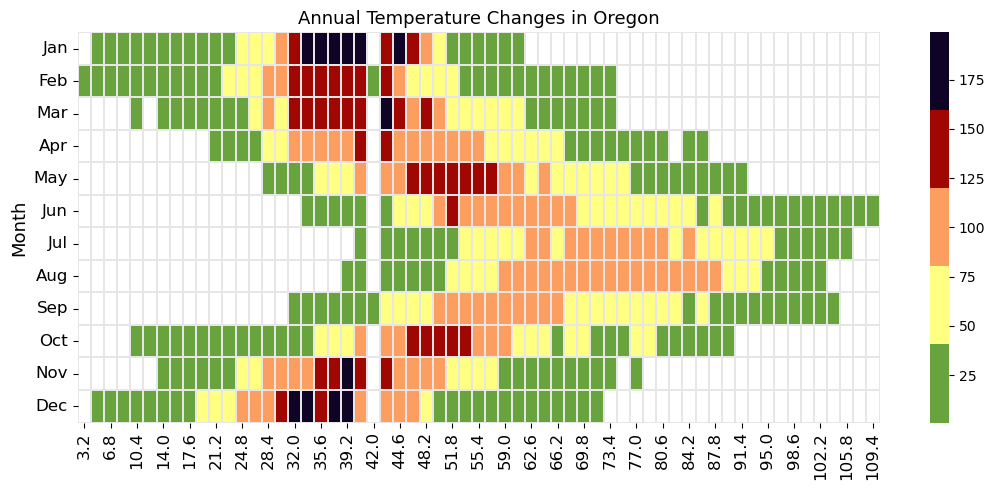
To obtain information about Oregon’s climate, we used the ‘riem’ package (available in R) to pull data from the Automated Surface Observing Systems (ASOS). Originally collected and stored by the National Weather Service, the ‘riem’ package is maintained by the Iowa Environmental Mesonet (IEM). We collected data related to dew point temperature, precipitation, and wind speed - all variables potentially related to wildfire activity. Our findings from these exploratory analyses are detailed below.
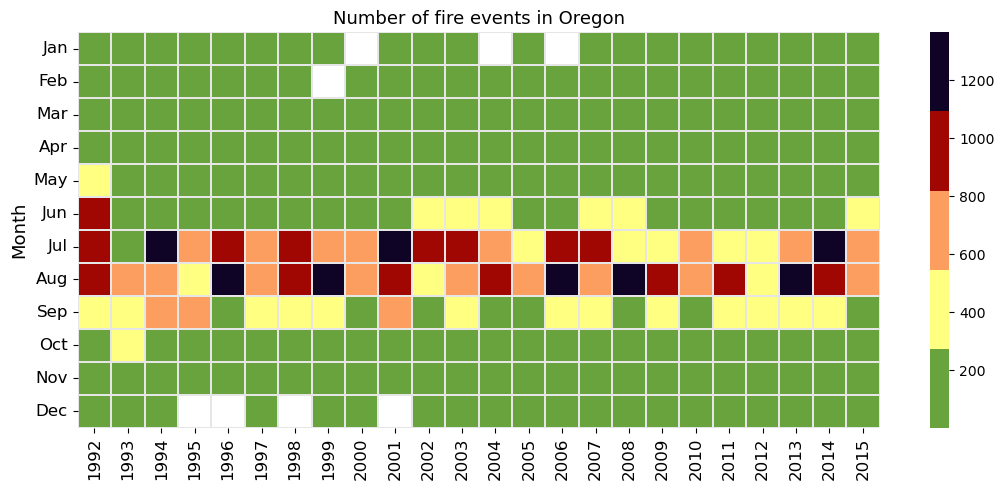
First, we observe the raw number of wildfires that occur in Oregon. There is a clear pattern of the summer months, July and August, being the most common months for wildfire season. This is a break in the pattern seen across the US, where wildfres occur throughout most times of the year. This can lead us to thinking that the causes of wildfires in Oregon may hold different factors than those seen in other areas of the country.
Dashboard (Acres burnt + Weather factors)
The visualization below presents an interactive dashboard that locates individual fires across Oregon recorded between 2014-15. To interact with the map, zoom into a specific location, then hover over a specific point to reveal important details about the fire (acreage burned and date of observation), as well as weather information (precipitation, temperature, and wind speed).
See below for an interactive Dashboard ↓